

Building a Squinting Pipeline for Weed/Crop Detection with Squint Vision Studio
How embedding-space monitoring can make embedded computer vision systems more reliable, efficient, and production-ready
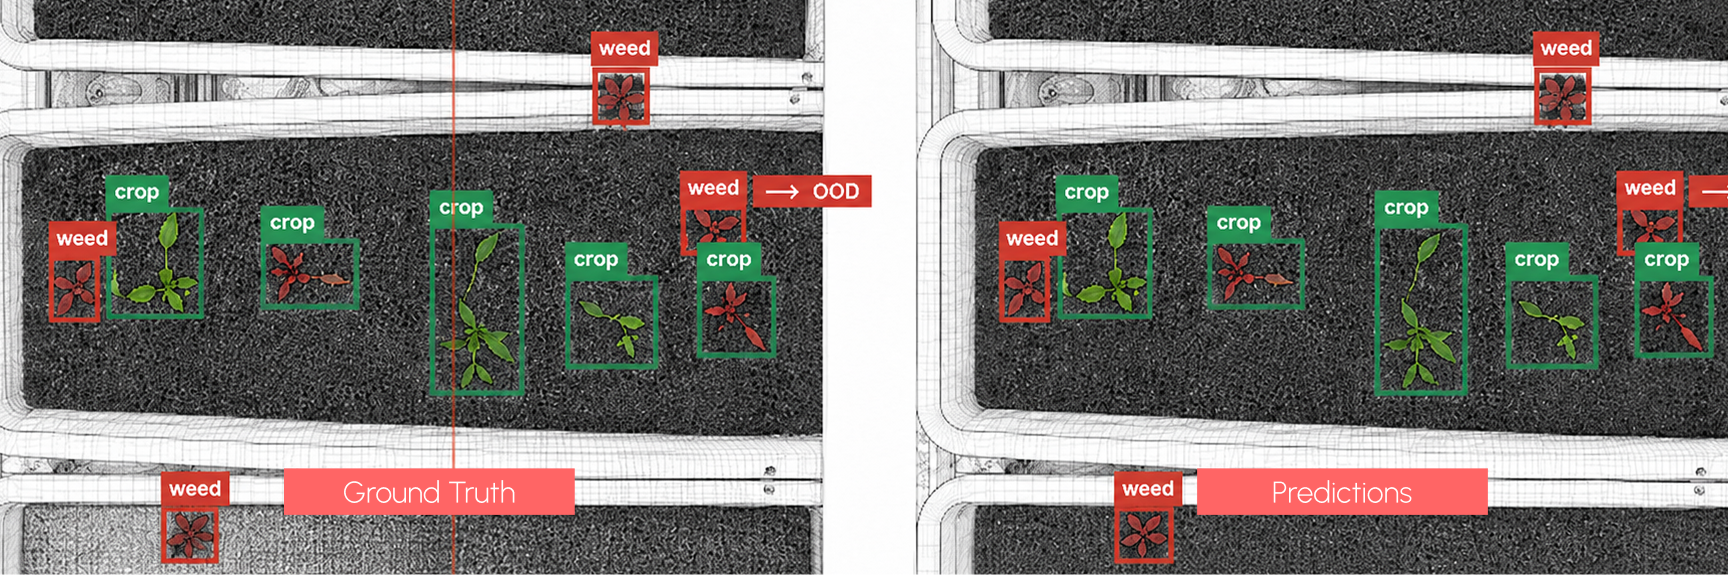
Figure 1 — Weed/crop object detection output. Ground-truth and predicted bounding boxes for crop and weed instances, including an out-of-distribution (OOD) flag on one predicted object.
The Squinting Pipeline transforms model predictions from a single output into an auditable decision process. By identifying trusted, ambiguous, and out-of-distribution samples at runtime, the system improved difficult-case accuracy by 11.1% while providing greater confidence in every prediction.
This refrain is as true in precision agriculture as it is in many applied machine learning (ML) domains. After months of intense development, an engineer can become convinced that two plant classes appear worlds apart in appearance. The dataset has been carefully curated to account for changes in angle, lighting, growth stage, and occlusion. Yet, inevitably, the model is deployed to a new environment, and the distinct line between those two plants begins to blur. Important crops are missed, weeds are misclassified, and confidence alone is not enough to disentangle the newly uncovered error modes.
Squint Vision Studio comprehensively addresses these issues. Rather than treating model analysis as something that ends after dataset curation and training, Vision Studio creates a Runtime Pipeline that carries model insight into production, where predictions are actually made.

Can the model tell when the
prediction should be trusted?
This article walks through a real-world application of Squint Vision Studio Pipeline, showcasing how runtime model insight can be used to identify ambiguous predictions, detect out-of-distribution inputs, and improve reliability in a weed detection pipeline.

Precision Agriculture and Its Challenges
The challenges of precision agriculture are real and well reported. In real agricultural environments, weeds vary significantly across species, regions, seasons, and growth stages; a dataset curated one day may not apply the next. Creating large annotated datasets is expensive and time-consuming, and rare or unseen weed species can weaken model generalization when models are deployed in new environments [1]. Model confidence often does not give insight into these problems. Convolutional neural networks (CNNs) can be poorly calibrated, returning high confidence scores despite low real-world accuracy or inputs that are far from the training distribution [2].
This project is based on finding new solutions to these limitations. Starting with a basic object detector like You Only Look Once version 8 (YOLOv8), how can we (a) detect when new lighting and species are degrading model performance and (b) decrease compute pressure at the edge while maintaining accuracy? Rather than relying only on confidence scores, this work uses Squint Vision Studio to inspect the model’s embedding space and create a Runtime Pipeline to inspect predictions.
What Vision Studio Does
Squint Vision Studio is a desktop application for analyzing trained computer vision models. It provides workflows for inspecting labelled datasets, quantifying and visualizing training results, and examining model behavior. Most relevant to this project, it can also be used to visualize a model’s embedding space. By analyzing this space and identifying areas where errors occur, users can create triggers that influence the model’s runtime behavior.
Instead of treating the classifier as a black box that only emits crop or weed, Vision Studio is built to better understand a model’s internal feature representation. This space holds a highly informative representation of how a model ‘views’ samples and makes decisions. By interpreting and understanding how data maps to this feature space, we can improve runtime decision making.
Turn model insight into
runtime action.
Vision Studio uses this embedding space to identify regions where model behavior is trustworthy, ambiguous, or potentially outside the training distribution. This analysis drives the following features:
- Ambiguity assessment
- Out-of-distribution (OOD) detection
- Trusted vs. ambiguous prediction routing
- Runtime model monitoring
Using Embedding Space to Generate Runtime Triggers
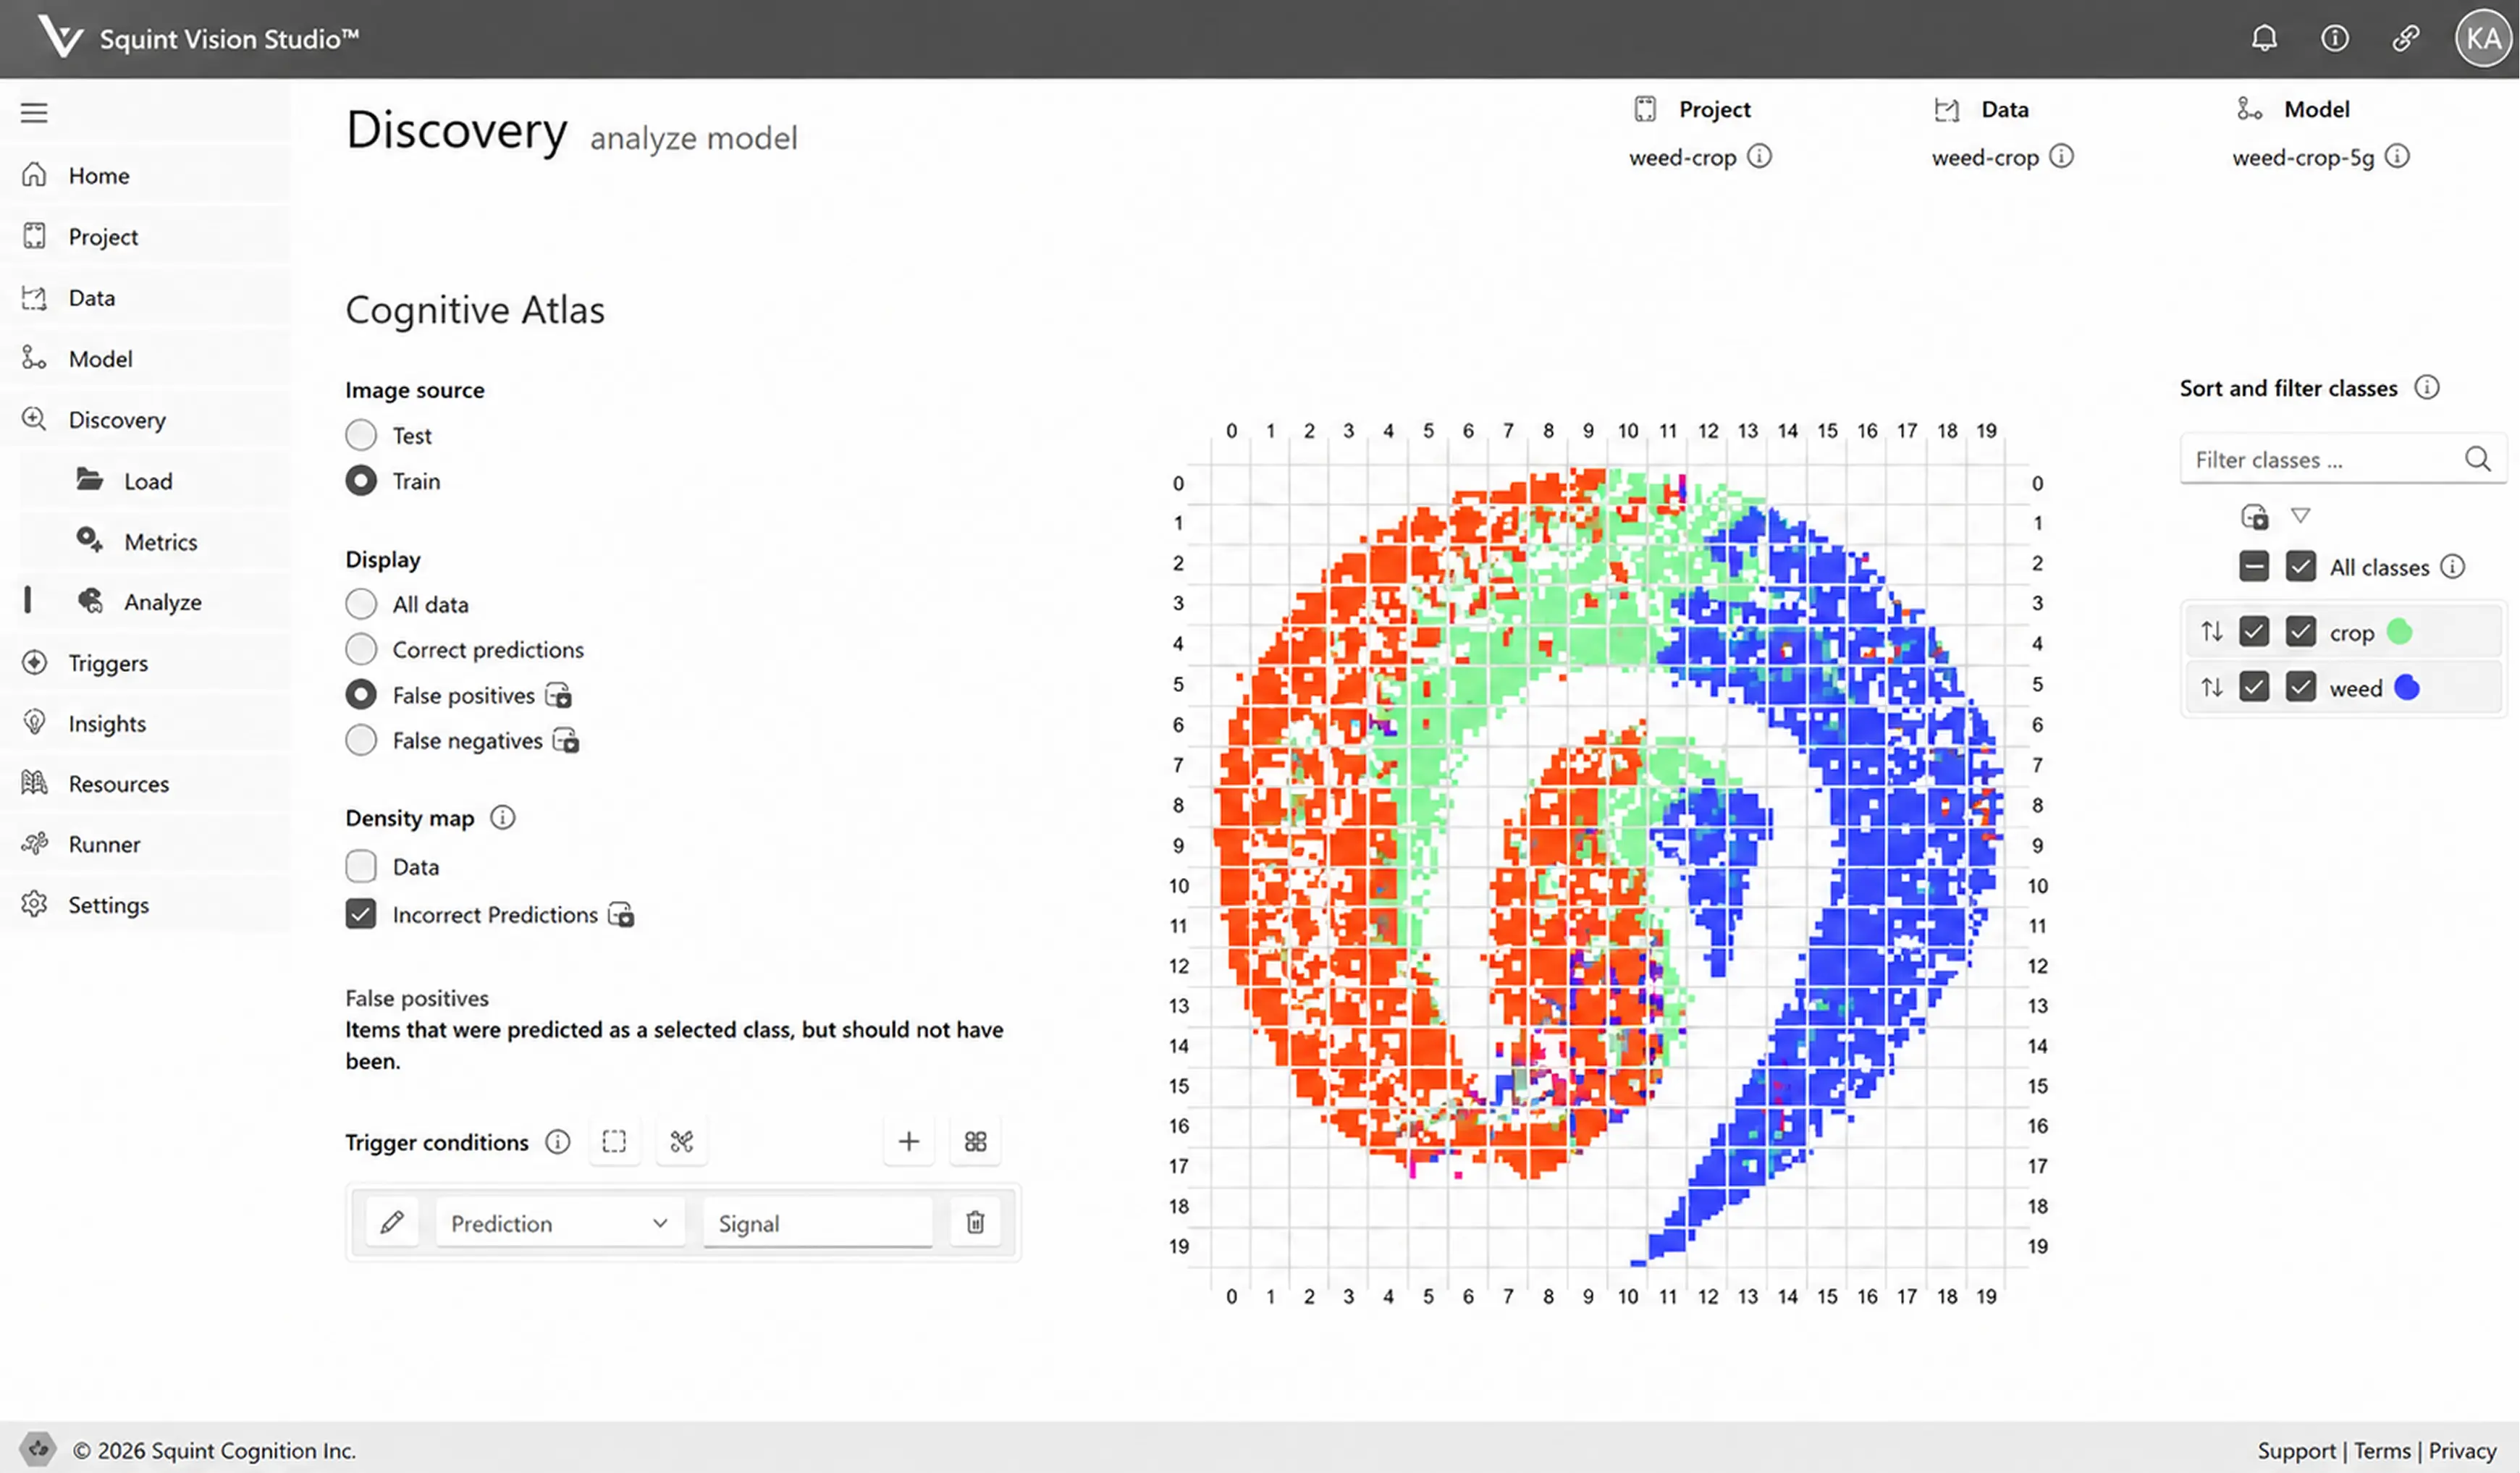
Figure 2 — Squint Vision Studio embedding atlas. A two-dimensional projection of embeddings where incorrect predictions and false positives concentrate near class-overlap regions.
Vision Studio provides the tools needed to modify PyTorch or TensorFlow models so that they can output embedding tensors alongside predictions. Once the model and dataset are uploaded to the studio, a clustering model is automatically trained on the dataset, producing a visualization of the generated embeddings. This projection maps the model’s high-dimensional internal representations into a space where class structure, overlap, and potential failure regions are easier to inspect.
In the Squint visualization, crop and weed samples form recognizable clusters. The most reliable samples tend to sit deep within their class regions, while more difficult samples appear closer to the boundaries where crop and weed embeddings begin to overlap.
Regions with prediction accuracy less than 70% were treated as ambiguous. At runtime, this allows the system to avoid treating every sample the same. If a new sample lands in a trusted region, the prediction can be accepted directly. If it lands in a more ambiguous region, the sample can be routed to a stronger model for additional review.
Regions of low density in the original embedding space are used to create triggers for out-of-distribution detection. Samples that are sufficiently far from known examples can then be flagged for additional processing, rather than being handled blindly by the base model.
The Squinting Pipeline Architecture
Once ambiguous regions and low-density regions are defined in Vision Studio, they are exported as a wrapper that accompanies the deployed vision model at the edge. This wrapper, referred to as the squinting pipeline, evaluates model outputs using triggers learned from the training data.
In this example, a YOLOv8 detector first identifies crop and weed objects in the input image. For each detected object, an embedding is derived and compared against the regions identified in Vision Studio. Based on this comparison, each object is categorized as trusted, ambiguous, or out of distribution.
At runtime, the pipeline uses these categories to determine how each prediction should be handled. Trusted samples continue through the normal inference path. Ambiguous samples can be escalated to a stronger classifier or review process. Out-of-distribution samples can be flagged for further inspection, relabeling, or future retraining.
The pipeline does not replace the original model. Instead, it adds a lightweight decision layer around it, helping the system decide when the base model can be trusted and when additional processing is worth the cost.
Vision studio watchdog Architecture
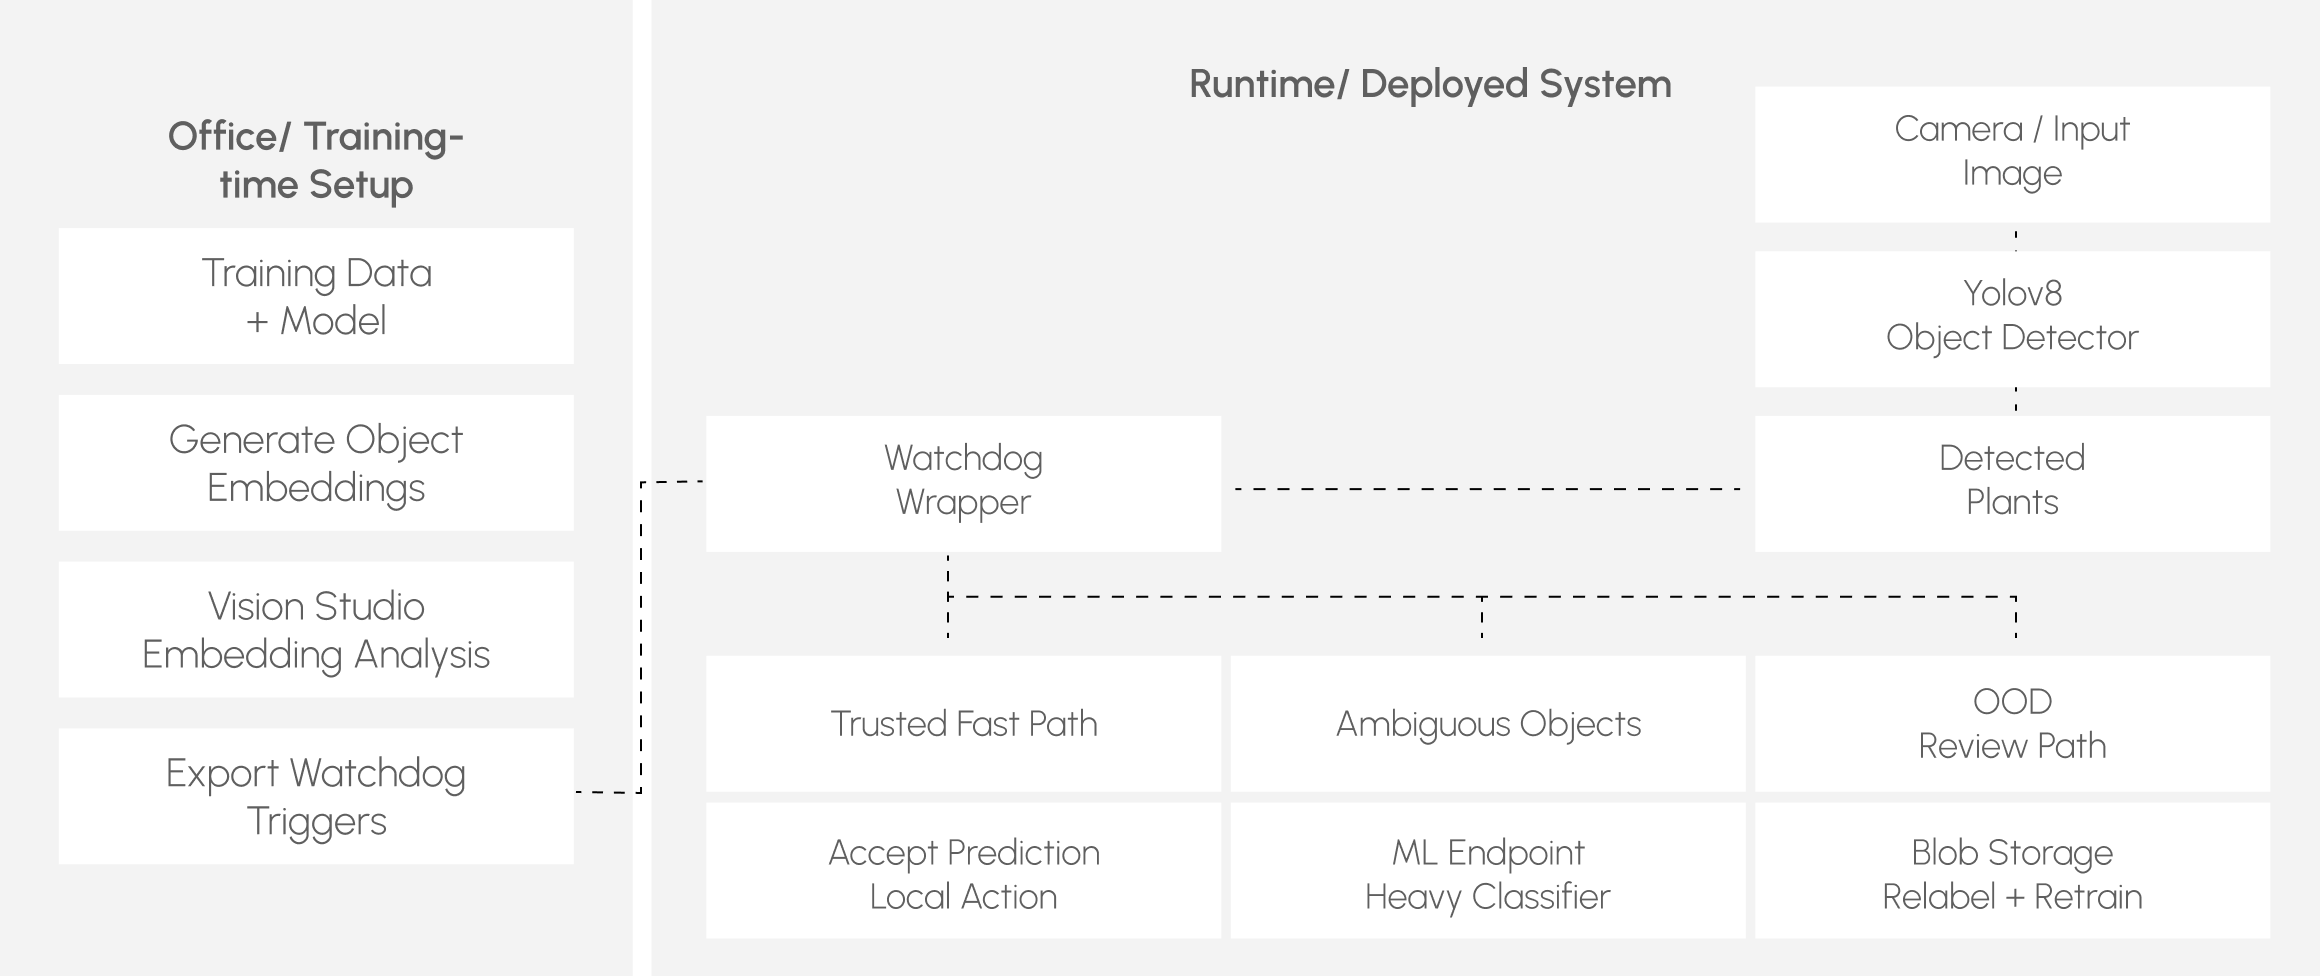
Figure 3 — Diagram showing the architecture of a Studio Squinting Pipeline integrated into a production ML system.
.png)
Production Integration: Edge Fast Path, Cloud Slow Path
Vision Studio addresses one of the critical shortcomings of modern vision systems: every item in a frame is often treated the same, regardless of the importance, ambiguity, or reliability of each detection. If every object is sent through the largest available model, cost and latency increase significantly. The squinting pipeline pattern provides a practical middle ground by identifying which detections can be handled on the fast path and which require additional attention.
Practically, the agriculture pipeline can be wired into an ML system as follows:
- The edge device runs the camera stream and object detector
- The squinting pipeline decides whether the prediction is trusted or ambiguous.
- Trusted predictions trigger a local action immediately.
- Ambiguous predictions are sent to a serverless ML endpoint running a heavier classifier, such as InceptionV3.
- OOD predictions are uploaded to Azure Blob Storage for relabeling and retraining.
During evaluation, the Squinting Pipeline continuously audited model predictions. It identified ambiguous detections that required additional review and selectively routed them to a more capable classifier. The out-of distribution detector further improved system awareness by identifying objects that differed significantly from the training distribution, routing them for relabeling.
Results: The Impact of the Squinting Pipeline
The results demonstrate the value of the Squinting Pipeline as a continuous prediction-auditing framework. The pipeline audited 100% of model predictions, automatically determining whether each fell within a trusted,
squinting pipeline results at a glance
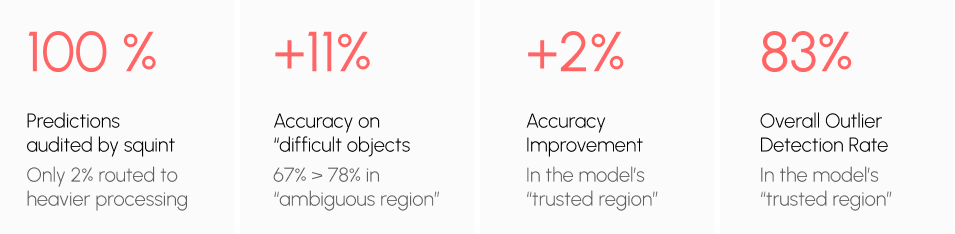
Figure 4 — Summary of results comparing Vision Studio Squinting Pipeline to Yolov8s Object Detection Only.
The YOLOv8s detector achieved an overall accuracy of 95.52% across the full test set. However, the Squinting Pipeline showed that model performance is not uniform across feature space. Within trusted regions, where the model had demonstrated consistent behavior during training and validation, accuracy increased to 96.91% across 750 samples. This confirms that the pipeline can identify regions where predictions can be made with a high degree of confidence.
The value of this auditing process becomes most apparent in ambiguous regions. While the lightweight model achieved only 66.67% accuracy on these challenging samples, automatic escalation to the InceptionV3 classifier increased accuracy to 77.78%, representing an 11.11% improvement. Rather than treating all detections equally, the pipeline identifies cases that require additional scrutiny and applies a more capable model when necessary.
The out-of-distribution (OOD) detector further strengthened predictive reliability by distinguishing familiar crop and weed images from previously unseen flowers. It correctly identified 86.43% of in-distribution samples and detected 78.53% of out-of-distribution samples, achieving an overall accuracy of 82.60% across 1,517 evaluations. This capability provides a mechanism for identifying situations where predictions should be treated with increased caution and where additional data collection or model retraining may be warranted.
Together, these results support the pipeline approach. Trusted samples remain efficient; ambiguous samples get a second pass, and unfamiliar samples can be flagged for review or future retraining. This improves reliability without adding unnecessary cost or latency to every prediction.
Why This Matters
The value of Squint Vision Studio is not simply that it improves a metric. The value is that it changes how the system behaves.
- “This looks like a crop and it is in a trusted region.”
- “This looks like a weed, but similar samples are often confused.”
- “This object does not look like anything the model was trained on.”
That difference matters in production. It gives ML teams a way to build systems that are more accurate on difficult samples, more transparent, cheaper to run, easier to monitor, better suited to human-in-the-loop workflows, and more resilient to real-world data drift.
Squint prediction samples
.png)